Unpacking cgroups in the cockpit overview metrics
One issue with the metrics view in cockpit as a desktop user
Cockpit is a great interface for Linux that keeps getting better. The storage and container management alone is worth it. But one nitpick I’ve got as a desktop user that doesn’t really show up with server use, well, users.
A little frame up
On a server, services all typically run under their own users. Most things on your desktop run as one user: the one you log in as. In 99.99% cases, you’ll never really need to think about that, unless you’re trying to do some system level process isolation on your PC. Since most things run as you, when you’re running low on resources like memory, “you” are likely the cause. And with all the tools to look at processes in Linux, each one shows you something slightly different.
You should be familiar with the differences between say top and free memory displays, although recent versions of top show the free / cache correctly. (or maybe I’m just dating myself) The Overview tab in Cockpit gets it’s info from another source: cgroups. In particular, the cpu and memory interface files for each cgroup on the host. So get the “systemd view” of the services and users, not necessarily a process based view. Most of what you are doing, and probably what you’re looking for to find that rogue process, is hidden inside user@1000: the systemd user slice for your user. 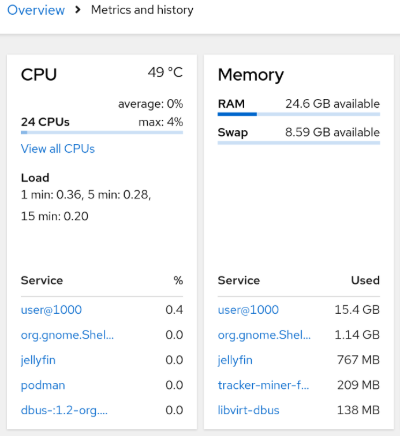 Two cards of the Cockpit metrics and history page, showing CPU and Memory utilization
A little slicing and dicing
With an overly broad brush, systemd uses cgroups to manage resources in two broad swaths: the system.slice and the user.slice. There’s more to it, and I’m not going in depth here, but think of it this way: any system level service controlled by systemd gets a cgroup under the system.slice and user controlled services go in the user.slice. Each logged in user also gets their very own slice of resources from the user.slice. If you ever used systemctl status and systemctl --user status, you’ve interacted with these different slices. There are other slices, and more hierarchy, but for this case, this is all we need to see what’s a level down from the Cockpit metrics.
A new wild top appears
You might not be aware that systemd also has tools to examine the cgroups it’s managing: systemd-cgls and systemd-cgtop. There’s more you can look at with those two tools, but I’m going to jump into systemd-cgtop and a little of our slice background.
From the screenshot, you see I want to figure out where this user@1000 character has it’s cgroup. That matches my UID, so you may see something different if you have a different UID.
So I said, each logged in user get’s it’s own slice from the main user.slice, so let’s throw that into a command line and see what happens. I’m also going to get the UID from the system instead of hard coding it so this should work for you if your UID is different without needing to edit the command.
1
$ systemd-cgtop user.slice/user-$(id -u).slice
A full terminal app should open that updates every few seconds and looks something like:
1
2
3
4
5
6
7
CGroup                                                                                                                 Tasks   %CPU   Memory  Input/s Output/s
user.slice/user-1000.slice                                                                                              1366   20.6    15.1G        -        -
user.slice/user-1000.slice/user@1000.service                                                                            1316   20.5    14.8G        -        -
user.slice/user-1000.slice/user@1000.service/app.slice                                                                  1029   18.9    13.5G        -        -
user.slice/user-1000.slice/user@1000.service/app.slice/app-gnome-org.mozilla.firefox-4026.scope                          499   17.8     3.4G        -        -
user.slice/user-1000.slice/user@1000.service/session.slice                                                               280    1.7     1.2G        -        -
user.slice/user-1000.slice/user@1000.service/session.slice/org.gnome.Shell@wayland.service                                60    1.7       1G        -        -
There’s still more hierarchy here under the user@1000.slice. A systemd service is managing two more slices: app.slice and session.slice, and there’s something called a scope. All of this is internals for systemd that you’ve probably never really needed to look at, but right at the top there’s a few useful things.
Interpreting the paths
The first line shows us Memory usage that’s in line with what’s in the Overview metrics, our user is using ~15G of RAM. Dropping down, we can see a good chunk is used by the app.slice and there we see things like firefox happily using most of that. Most of what you use will likely be in that app.slice. The other big consumer there is the Gnome Shell under the session.slice at ~1G. Depending on your environment, you might see something else, but that’s mainly for what’s running your currently active session.
Since I’m likely looking for an app chewing up memory or cpu cycles, let’s limit what I’m seeing by targeting just one of the slices: the app.slice. I need to add the .service as well to get the full path to the cgroup resources. This will also figure out the UID instead of hardcoding it.
1
$ systemd-cgtop user.slice/user-$(id -u).slice/user@$(id -u).service/app.slice
We get a narrower view of the apps and services that I’ve started, including the terminal and my media server.
1
2
3
4
5
6
7
CGroup                                                                                                                 Tasks   %CPU   Memory  Input/s Output/s
user.slice/user-1000.slice/user@1000.service/app.slice                                                                  1261   11.2      14G        -        -
user.slice/user-1000.slice/user@1000.service/app.slice/app-gnome-org.mozilla.firefox-4026.scope                          722   10.4     3.9G        -        -
user.slice/user-1000.slice/user@1000.service/app.slice/dbus-:1.2-org.gnome.Ptyxis@1.service                               15    0.3    37.2M        -        -
user.slice/user-1000.slice/user@1000.service/app.slice/run-r25f0f897ba1c452087d2fd8e5ce07f59.scope                         2    0.3    15.9M        -        -
user.slice/user-1000.slice/user@1000.service/app.slice/podman.service                                                     21    0.1    61.2M        -        -
user.slice/user-1000.slice/user@1000.service/app.slice/jellyfin.service                                                   22    0.0   731.5M        -        -
If you’ve ever been hunting for a process that’s chewing up resources, and you can’t quite find it, you now have a few more tools in your toolbox.